I gathered using some different websites
Climate of Lake Anna
Below is a table of factors that contribute to the climate of the eastern piedmont which Lake Anna is part of. I put together the chart using data from the following National Centers For Environmental Information website
Month
|
Temperature Maximum Average (F)
|
Temperature Minimum Average (F)
|
Precipitation Average (‘’)
|
January
|
46.8
|
26
|
3.33
|
February
|
49.6
|
27.3
|
2.93
|
March
|
58.7
|
34.5
|
3.73
|
April
|
68.7
|
43.3
|
3.73
|
May
|
77.3
|
52.7
|
3.87
|
June
|
84.4
|
61.4
|
3.89
|
July
|
87.8
|
65.9
|
4.45
|
August
|
86
|
64.4
|
4.55
|
September
|
80.1
|
57.6
|
3.76
|
October
|
70
|
45.1
|
3.26
|
November
|
59.2
|
35.3
|
2.93
|
December
|
49.1
|
28.2
|
3.30
|
Researchers at The University of Berkley have used data to create a map that shows the average annual Carbon footprint in different counties in the United States. Below is the information for the area of Louisa County near the Waste heat Treatment Facility. More information can be found at http://coolclimate.berkeley.edu/maps .

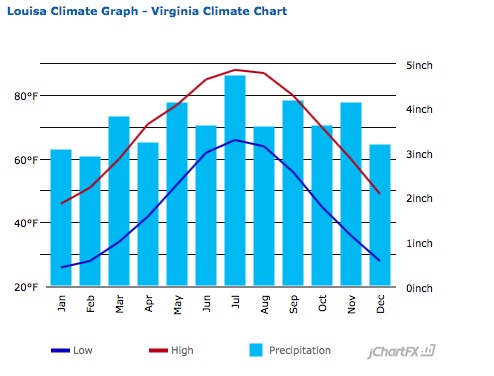
The following website does a really good job compiling and displaying many different types of climate data for different counties http://www.usclimatedata.com/climate/louisa/virginia/united-states/usva0445
Below are climate graphs from that website for two of the three counties that include Lake Anna. I could not find data on Spotsylvania county so I do not have a graph for that.

No comments:
Post a Comment