The following is an outline for how to plan a nonprofit in Virginia. This outline could be used by a group who might want to help monitor the environment and ecology of the lake anna area.
This website http://www.nolo.com/legal-encyclopedia/forming-nonprofit-corporation-virginia-36091.html along with an example from our class professor was helpful in preparing this document
Sunday, August 13, 2017
Tuesday, August 8, 2017
Dendrology of Virginia
Here is a set of slides I posted previously that also connects to the trees in the Lake Anna area. Before the creation of Lake Anna the area was mainly trees with a very low human population.
Articles on the Pollution of Contrary Creek and Hydrilla Management
Here is an interesting article I found at lakeannalife about one of the creeks I mentioned in my map post. It is on page 16 of the link, if you can not read it in this post.
There is a very detailed article about the 2015 treatment of hydrilla on pages 5,7, and 17 of the same issue.

There is a very detailed article about the 2015 treatment of hydrilla on pages 5,7, and 17 of the same issue.

Sunday, August 6, 2017
Tuesday, August 1, 2017
Climate and Weather of Lake Anna
Here are some examples of climate and weather information
I gathered using some different websites


I gathered using some different websites
Climate of Lake Anna
Below is a table of factors that contribute to the climate of the eastern piedmont which Lake Anna is part of. I put together the chart using data from the following National Centers For Environmental Information website
Month
|
Temperature Maximum Average (F)
|
Temperature Minimum Average (F)
|
Precipitation Average (‘’)
|
January
|
46.8
|
26
|
3.33
|
February
|
49.6
|
27.3
|
2.93
|
March
|
58.7
|
34.5
|
3.73
|
April
|
68.7
|
43.3
|
3.73
|
May
|
77.3
|
52.7
|
3.87
|
June
|
84.4
|
61.4
|
3.89
|
July
|
87.8
|
65.9
|
4.45
|
August
|
86
|
64.4
|
4.55
|
September
|
80.1
|
57.6
|
3.76
|
October
|
70
|
45.1
|
3.26
|
November
|
59.2
|
35.3
|
2.93
|
December
|
49.1
|
28.2
|
3.30
|
Researchers at The University of Berkley have used data to create a map that shows the average annual Carbon footprint in different counties in the United States. Below is the information for the area of Louisa County near the Waste heat Treatment Facility. More information can be found at http://coolclimate.berkeley.edu/maps .
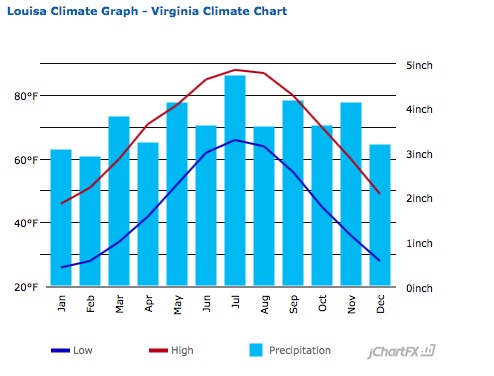
The following website does a really good job compiling and displaying many different types of climate data for different counties http://www.usclimatedata.com/climate/louisa/virginia/united-states/usva0445
Below are climate graphs from that website for two of the three counties that include Lake Anna. I could not find data on Spotsylvania county so I do not have a graph for that.
Subscribe to:
Posts (Atom)