The following is an outline for how to plan a nonprofit in Virginia. This outline could be used by a group who might want to help monitor the environment and ecology of the lake anna area.
This website http://www.nolo.com/legal-encyclopedia/forming-nonprofit-corporation-virginia-36091.html along with an example from our class professor was helpful in preparing this document
Sunday, August 13, 2017
Tuesday, August 8, 2017
Dendrology of Virginia
Here is a set of slides I posted previously that also connects to the trees in the Lake Anna area. Before the creation of Lake Anna the area was mainly trees with a very low human population.
Articles on the Pollution of Contrary Creek and Hydrilla Management
Here is an interesting article I found at lakeannalife about one of the creeks I mentioned in my map post. It is on page 16 of the link, if you can not read it in this post.
There is a very detailed article about the 2015 treatment of hydrilla on pages 5,7, and 17 of the same issue.

There is a very detailed article about the 2015 treatment of hydrilla on pages 5,7, and 17 of the same issue.

Sunday, August 6, 2017
Tuesday, August 1, 2017
Climate and Weather of Lake Anna
Here are some examples of climate and weather information
I gathered using some different websites


I gathered using some different websites
Climate of Lake Anna
Below is a table of factors that contribute to the climate of the eastern piedmont which Lake Anna is part of. I put together the chart using data from the following National Centers For Environmental Information website
Month
|
Temperature Maximum Average (F)
|
Temperature Minimum Average (F)
|
Precipitation Average (‘’)
|
January
|
46.8
|
26
|
3.33
|
February
|
49.6
|
27.3
|
2.93
|
March
|
58.7
|
34.5
|
3.73
|
April
|
68.7
|
43.3
|
3.73
|
May
|
77.3
|
52.7
|
3.87
|
June
|
84.4
|
61.4
|
3.89
|
July
|
87.8
|
65.9
|
4.45
|
August
|
86
|
64.4
|
4.55
|
September
|
80.1
|
57.6
|
3.76
|
October
|
70
|
45.1
|
3.26
|
November
|
59.2
|
35.3
|
2.93
|
December
|
49.1
|
28.2
|
3.30
|
Researchers at The University of Berkley have used data to create a map that shows the average annual Carbon footprint in different counties in the United States. Below is the information for the area of Louisa County near the Waste heat Treatment Facility. More information can be found at http://coolclimate.berkeley.edu/maps .
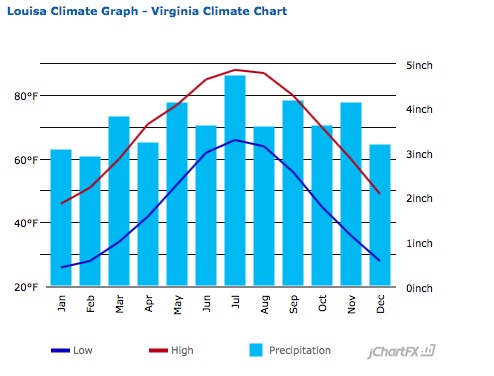
The following website does a really good job compiling and displaying many different types of climate data for different counties http://www.usclimatedata.com/climate/louisa/virginia/united-states/usva0445
Below are climate graphs from that website for two of the three counties that include Lake Anna. I could not find data on Spotsylvania county so I do not have a graph for that.
Monday, July 31, 2017
Lake Anna Map
First is a map I put together using Google My Maps. It includes key areas related to the Lake Anna area. Click around and read the captions I've included in the map to understand the area better.
Below it is a similar map I made with ArcGIS. I personally found it easier to use the Google applicaiton, however that does not mean it is better. I think I need to learn more about using ArcGIS. I probably could have found files for some of the features/borders I included by hand. I foudn it easier to draw features by hand using the Google application. I also had challenges creating a key in ArcGIS like I was able to do in Google My Maps. I do like all the different types of base maps you can use with ArcGIS.
Below it is a similar map I made with ArcGIS. I personally found it easier to use the Google applicaiton, however that does not mean it is better. I think I need to learn more about using ArcGIS. I probably could have found files for some of the features/borders I included by hand. I foudn it easier to draw features by hand using the Google application. I also had challenges creating a key in ArcGIS like I was able to do in Google My Maps. I do like all the different types of base maps you can use with ArcGIS.
Visit to Lake Anna Nuclear Information Center
Today I was able to visit the North Anna Nuclear Information Center. I learned more about the nuclear power plant, how Dominion decided on a location to create the lake, and about some of the impacts on the Environment. I plan on visiting the state park in the area soon, and I will post more information that I gather from them once I am able to visit when they are open.
The nuclear information center does programs with schools, and I am working on seeing if I can put together a joint trip to that center and the Lake Anna State Park.
Here is a picture of the area when they were first creating the lake in the late 1960s/early 1970s. I apologize for the poor quality. In 1968 Dominion purchased 18000 acres of land, and today Lake Anna covers 13000 of those acres.

Here is a map of the different nuclear power plants in Virginia

Here are some examples of displays they have at the center

Saturday, July 29, 2017
The Basics of Ecology Screencastify Recording
Click on the link below to see the screencast I mentioned I would be making in the previous post using screencastify. It was the first time I ever did anything like that, so please forgive me for any kinks during the video :) There are definitely some minor hiccups in the screen cast. However, it gives you an idea of what the tool is capable of, it allowed me to practice using the tool, and it is an example of what that presentation would be like if I were to give it to a group of people.
I had challenges embedding the video file, so that is why I am providing the link. It is 61 minutes long, and that might be why I had challenges. If you would like to go through it at your own pace+skip the youtube videos included, you can go through the individual slides posted in the previous post. You can also click on the settings icon in the previous post to view the notes that go with the slides.
https://drive.google.com/file/d/0B3lwF95XBzKXOWI2TGhvbW9kVjA/view?usp=sharing
The Basics of Ecology Slides
Here is the slideshow presentation I put together on the basics of ecology. This took me a while because of some summer trips I had and because I was learning how to use a new tool called Screencastify https://chrome.google.com/webstore/detail/screencastify-screen-vide/mmeijimgabbpbgpdklnllpncmdofkcpn?hl=en I have made a screen cast using that tool and I hope to post it shortly. The screen cast is about 1 hr long, but it is closer to 40 minutes if you don't watch the videos.
Friday, June 16, 2017
Area of Study: Lake Anna Reservoir
I have chosen the location of the North Anna River and the Lake Anna reservoir as the areas of focus for this course. The North Anna River was dammed in 1972 to create a reservoir by what is now Dominion Energy to form the Lake Anna reservoir which is used for cooling water for the waste heat treatment facility connected to the North Anna Nuclear Power Plant. Many people who live in the area use the water for recreation purposes. I would like to investigate the current biodiversity in different parts of the area related to the recreational uses and where different temperatures are. I had two main reasons for why I chose this location. First, the North Anna Power Plant is very close to the area I and my students live (about 30-40 miles away), but it is far enough away that many of my students don’t realize that it exists until we discuss it in class. I often get a lot of questions related to the plant and its impact on the area, and I think this will help me be better prepared to answer the questions. I think this will also help me create lessons to help students understand the impact of the plant on the area it is in. The other reason I chose it is because I have family that owns a lake house on the the lake, and I have often wondered about the impact of the cooling waters on the life in the area.


Biodiversity
Hello! I am back. I am now shifting the topic of this blog to focus on studying biodiversity.
My initial definition of biodiversity: Biodiversity is an area of study/ subject that focuses on specific geographic areas, the ecosystems in those areas, and the variety of life that lives in those ecosystems. Understanding the biodiversity and change in biodiversity in an area can allow scientists to interpret the impact of climate, natural diversity, pollution, and human development on an area.
Edited definition after research: In addition to the definition above, the national wildlife federation https://www.nwf.org/Wildlife/Wildlife-Conservation/Biodiversity.aspxindicates that biodiversity is a wide range of life in an area. According to the website there can be multiple types of biodiversity. There can be species biodiversity, genetic biodiversity, and ecological biodiversity. The definitions and other interesting facts can be found at the website.
Subscribe to:
Comments (Atom)